Content Scoring: How to Measure and Improve Content Quality With Performance Scorecards

Content: It’s everywhere. And, managing it’s getting out of hand, especially when generative AI is churning it out at unprecedented speed. It’s also difficult to manage because, until recently, it was seldom thought of as a business asset worthy of measurement. But that’s quickly changing.
Measuring takes the guesswork out of business. Collecting metrics allows companies to focus their efforts on quantifiable factors (key performance indicators) that are directly linked to achievable business goals.
Measurement allows us to know whether the time, effort, and money we invest in what we do is worth it. Metrics provide us with actionable data on which we can make informed business decisions.
To create high-quality content, we must measure our content against a formal set of quality criteria. And, in order to scale content production, we must automate as much of the measurement process as possible. By leveraging the power of computers and artificial intelligence, we can do that today.
What is content scoring?
Content scoring is a data-driven method used to evaluate the quality, effectiveness, and engagement of content. It helps businesses assess how well their content performs and whether it aligns with their goals.
Content scoring allows organizations to measure the impact of their content both before and after publication. Through this process, they identify areas for improvement, optimize their strategy, and ensure their content resonates with the target audience.
The process involves assigning scores based on predefined metrics, such as readability, SEO optimization, engagement, and conversions. These factors help determine how effective the content is at driving traffic, retaining readers, and encouraging desired actions
How to use content analytics for data-driven decisions
To answer this question, it’s important to look at different types of analytics separately. Fundamentally, there are four main types of analytics every content team needs to consider to get the best results. They are:
Type 1: Content production metrics
With content production metrics, you’re simply keeping tabs on if you’re actually delivering all the content you’ve said you’ll create as part of your goals. If you’ve committed to publishing two blog posts a week, a biweekly podcast, a monthly case study, and two eBooks every quarter, are you actually producing all of that?
Keeping track of this stuff is an important reality check. If your content team isn’t meeting its commitments, it could mean you’re trying to do too much with too few resources. Or maybe it’s a sign that you’re not allocating your resources efficiently.
Type 2: Content performance metrics
Any time you publish a piece of content, the usual knee-jerk reaction is to look for immediate validation about how well it performed. How many people saw it? Liked it? Shared it? And while this kind of information can be motivating, the reality is that not all of the metrics in this category are equally useful. In fact, when it comes to helping you deliver better business outcomes, only a handful actually matter.
Think of content performance metrics as falling into two buckets. There are the so-called vanity metrics (number of views, listens, sessions, users, and so on). They’re a clear indication that you’re reaching more people, but that may not actually help drive meaningful business results. And then there are the metrics that demonstrate how you’re actually helping your company meet its goals. These include things like number of goal completions, the length of your sales cycle, and your customer service costs.
The bottom line is that content performance metrics are important, but you have to know which ones have real implications for your business and which ones don’t. And even though you want to improve all of these metrics, remember that the only one that ultimately matters to your executive team is how you helped drive sales by delivering qualified leads.
Type 3: ROI metrics
All of the metrics we’ve looked at so far are useful, but ROI metrics take things a step further. They demonstrate the value you’re creating for your business by investing time and money in content. Unfortunately, calculating the ROI of your content is a lot easier said than done. In fact, according to research from HubSpot, 40 percent of marketers say that proving the ROI of their marketing activities is their top marketing challenge. But it’s an activity that’s worth doing. Marketers who calculate ROI report they’re 1.6 times more likely to receive higher budgets.
When it comes to ROI metrics, two things matter: How much value your content is generating overall and how much it’s generating on a piece-by-piece or type-by-type basis. That way, you can measure your ROI in general, and also for specific assets and types of assets. ROI metrics are important because they can retroactively help you rationalize your existence. It’s one thing to demonstrate value by using the right performance metrics, but you also need to balance that against the cost of what you’re doing. ROI metrics will help you bridge that gap.
To calculate ROI, you can use this process from the Content Marketing Institute.
Type 4: Content quality and governance metrics
The major flaw that all the metrics we’ve discussed here share is that they’re only available once you’ve published your content. And while you can still use them to adjust your content and your content marketing program, you’re always left doing so after the fact. To get the best results, you also need metrics that help you optimize your content and your content creation processes before you ever publish anything. Specifically, you need:
Content quality metrics. These include things like the clarity and accuracy of your content, its tone of voice, and how consistent it is with your company’s unique brand standards and terminology. By evaluating these things through a content score before you publish, and making the necessary changes, you can reliably enhance the chances of your content getting the best results.
Governance metrics. There are a number of metrics that are important to capture and use to help make your content creation teams more efficient. For example, your content managers care about quality trends, readability trends, editing cost savings, frequency of terminology usage, and individual and overall authoring scores and improvement. Meanwhile, your translation manager cares about content length, content clarity, and translation savings. And, at the point of publishing, management cares about content usage, conversion, and user satisfaction.
For content success, you need to measure what you’re doing and the impact it’s having on your business. With the rise of generative AI, content scoring has become even more important than ever before.
Of course you don’t need to get bogged down in the data or become a victim of analysis paralysis. It’s up to you to decide which metrics you’ll track, at what frequency, and how.
To help, we’ve published a comprehensive eBook that goes into a lot more detail about each of these metrics.
Why content analytics matter
The words we choose to use have a tremendous impact on others. We know this instinctively. The right words can inform, instruct, and inspire. The wrong ones can confuse, confound, and contradict.
Content conveys the personality of your brand. It often represents the first impression of your company. It projects your values and sets expectations for both prospects and customers alike.
Producing high-quality content is critical to business success. Quality content follows rules (sentence structure, spelling, punctuation, and grammar). It is also easy to read and understand. High-quality content is consistent in style and structure, and in tone of voice. If you use a content checking software, you’ll get a content score to reflect how well you’ve performed in these areas.
Writers and editors have traditionally been responsible for ensuring the right words are used — and the wrong ones are not. They work to make certain that your content is of high quality. But, despite their best efforts, writers and editors are error-prone. Not only that, they are not scalable.
Armed with style guides and generative AI, writers attempt to craft high-quality content that complies with a lengthy checklist of rules they must first study, learn, and use. When they make a mistake, someone is expected to catch that error in review. But that’s not always what happens.
Editors are often overburdened and are just as likely to make mistakes as their writers. Most editors rely on outdated mechanical (manual) editing processes to catch an increasing array of content problems, many of which may introduce unnecessary legal, regulatory, and financial risks.
Content scoring provides us with a set of rules against which to measure content quality.
How to measure content quality through content scoring
Content scoring tools are designed to help us monitor our progress over time toward an organizational goal. The Acrolinx scoring strategy uses Scorecards that contain targets (goals we strive to achieve) and key performance indicators (measurements that tell us whether we are reaching our goals or not).
Well-designed performance scorecards use commonly understood visual metaphors to allow us to quickly determine whether we are on the right track or not. The data they present are the visual answer to the question: “How well are we doing?”
Content scoring is used across all industry sectors and vertical markets. They are most effective when they are designed to capture outcomes (how well we did) and when we build rewards into the system.
As leadership guru John E. Jones once said: “What gets measured gets done. What gets measured and fed back gets done well. What gets rewarded gets repeated.”
How to set up a successful content scorecard
Performance scorecards provide insights into our strengths and weaknesses. They help us see opportunity for improvement, provide us with a way to prioritize our efforts, and ensure that we are meeting business goals. But collecting performance data manually is slow, inconsistent, and error-prone.
Performance measurements are most valuable when integrated into software tools we use to create content. By automatically capturing relevant measurements and providing real-time feedback to content creators, we can reduce the amount of work required to produce high-quality content. Faster time-to-market, increased consistency, and reduced costs are some of the many benefits of such an approach.
Common reasons why performance scorecards fail
Scorecards are not magical. They don’t do anything by themselves. Their value is heavily dependent on how they are executed.
The biggest reasons why performance scorecards fail is disagreement over what data to measure, how to measure and collect it, and what the resulting findings mean. To be successful, scorecard data must be defined in the same way by everyone using it. All parties involved must agree on a common definition of the data being collected. Data should be uniformly measured and specific actions taken as a result of the findings.
There are other reasons scorecards fail. One of the most important to recognize is that some people don’t like the idea of being monitored. There are many reasons why people dislike being monitored.
First, measuring means paying attention to details. Not everyone wants that level of scrutiny paid to their work.
Second, some people see performance monitoring as a way to measure their personal performance. Scorecards are used most often to ensure business outcomes, not to monitor people. To ensure that performance scorecards provide the most value to the organization, it’s important to communicate what is actually being measured.
For example, the marketing communication team at Illumina, a Silicon Valley medical device manufacturer, uses a content scorecard system to determine what content performs the best. Writers use Acrolinx software to score the content they create in real time. The software measures adherence to standard linguistic, grammar, spelling, and punctuation rules. It also provides readability scores and allows the company to encode its writing, style, branding, and corporate terminology rules into the authoring process.
Before publication, each piece of content is scored. Scores for each piece of content produced are stored as metadata in the company’s content management system. The marketing team combines content quality scores from Acrolinx with typical web content metrics (number of visitors, length of visit, and on-site behavior, including number of actions completed). They do this to show that content quality metrics do matter. Illumina has found that content that meets quality standards often outperforms content produced without the benefit of automated, real-time scoring.
Content scoring in action: How Acrolinx improves your content
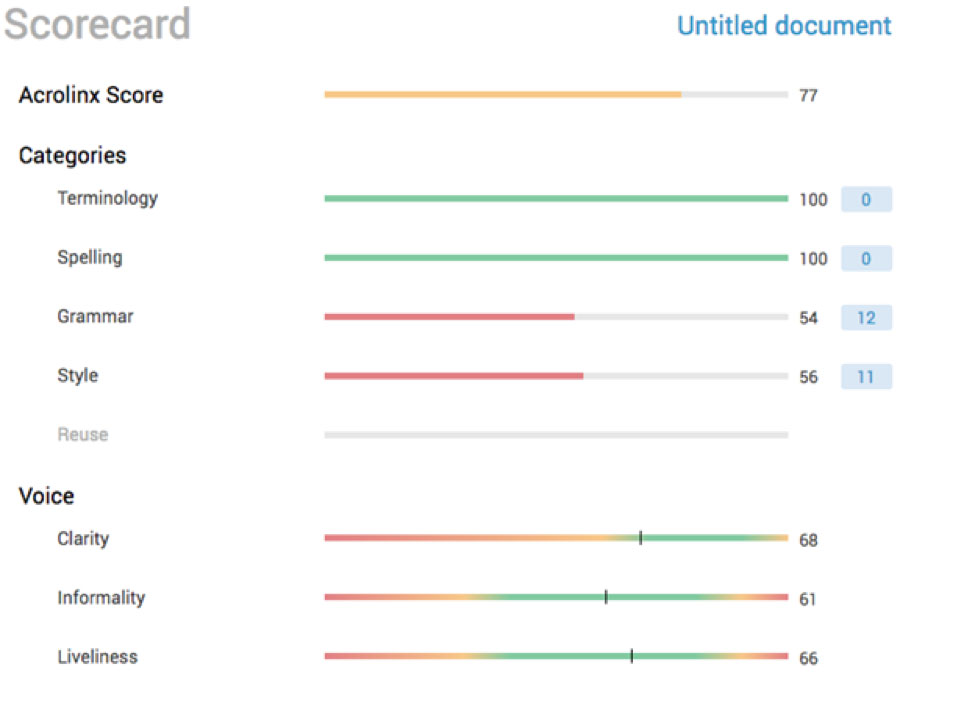
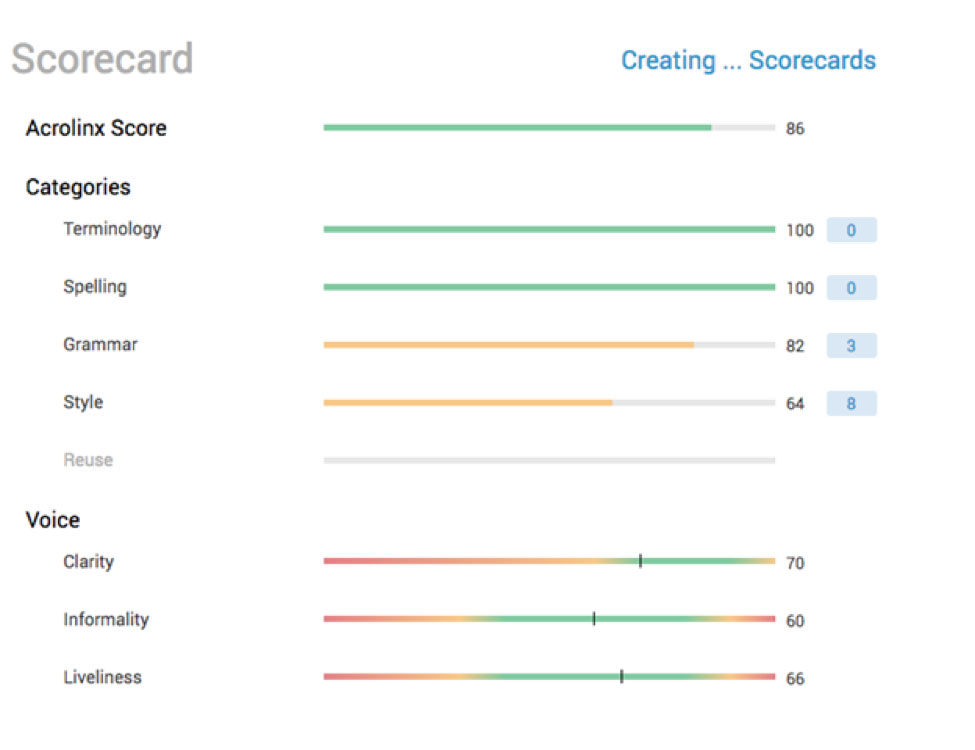
I wrote the first draft of this article without the help of content scoring software. Once I was happy with it, I sent it to an editor. Then, we ran the edited draft through Acrolinx. The draft scored fairly well (77 out of 100), but there were grammar and style violations. And, it wasn’t written as clearly as it could have been.

But, with just a few changes recommended by Acrolinx, I was able to make improvements that raised my overall Acrolinx score. And, I spotted some errors that emerged during the writing and editing process.

Using a scorecard approach makes producing quality content the focus of our work, not micromanaging writers and editors. Acrolinx is designed to guide content creators toward the creation of quality content. Content that complies with an agreed-upon set of rules. Content that follows an agreed-upon style. Content that meets customer expectations and helps us achieve business goals.
To create high-quality content at scale, we can’t rely on human editors alone. Instead, we must leverage the power of software to help us. We must automate the measurement process as much as possible. By leveraging the power of Acrolinx, we can do that today.
Frequently asked questions
A tool measuring content against quality metrics like clarity and tone. Acrolinx delivers real-time Scorecards for every piece of content.
Typically 80+ on the Acrolinx Score indicates strong alignment with enterprise standards.
It’s a quantitative measure of how well content meets defined guidelines. Acrolinx assigns this based on dozens of factors including tone, consistency, and clarity.
Are you ready to create more content faster?
Schedule a demo to see how content governance and AI guardrails will drastically improve content quality, compliance, and efficiency.
The Acrolinx Team


